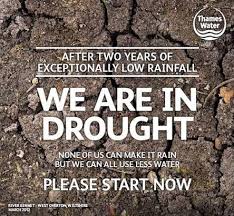
West Thames Area Drought Statistics March 2012
 The Environment Agency West Thames area report for March 2012 reveals there was only 38% of the March long term average rainfall and only 17% of the March LTA of effective rainfall. Most of the key river sites were exceptionally low for the time of year and all but one of the key groundwater monitoring sites had lower than normal groundwater levels at the end of the month.
Rainfall
March was another dry month with 38% of the LTA monthly rainfall for Thames West area. The majority of this rainfall occurred in the first week of March. Most areas saw some rainfall in the middle of the month but the last two weeks of the month were dry. Rainfall was greatest in the Chilterns West which had 51% of its March LTA rainfall. All of the other West Thames areas had less than half the normal March rainfall with the Wey catchment having the least with only 29 % of its March LTA. The 2011- 2012 winter period, from October to March, was the 5 th driest winter period in the West Thames since our rainfall records began in 1920. In total West Thames had only 63% of the usual winter rainfall, making this the second consecutive winter with below average rainfall. The 18 months since October 2010 have been the 2 nd driest corresponding period for West Thames Area, only 1921-22 was drier. The south east of England remains in drought status.
Soil Moisture Deficit (SMD) /Recharge
SMDs were higher than normal in all West Thames catchments at the end of the March with the greatest being in the Ock, Thame and Berkshire Downs. The soil moisture model indicates that SMDs did not return to zero (as usual) this winter in these catchments, as well as in the West Chilterns. There was limited effective rainfall in March across much of the West Thames this month. The Cherwell had the most effective rainfall but this was significantly less than we would normally expect at this time of year with only 36% of the March LTA. In the Ock and Thame catchments there was no effective rainfall at all in March. The overall effective rainfall for the area was just 16% of the normal March amount. Over the 2011-2012 winter period effective rainfall was 17 % of the LTA. All catchments had a third or less of the effective rainfall that we would normally have over this period. Effective rainfall was highest in the North Downs (Hampshire) with 33%, followed by the Wey (Greensand) with 32% and the West Cotswolds with only 30% of the winter LTA. The Upper Thames only had 7% of the normal winter effective rainfall and the Ock and Thame had no effective rainfall at all.
River Flows
Monthly mean river flows in March were exceptionally low at all but three of our indicator sites. Only the River Wye at Bourne End and the River Wey measured at Weybridge and Tilford had month mean flows that were notably low as opposed to exceptionally low. The River Thames at Windsor and the River Thame at Wheatley both recorded their lowest March mean flows, whilst the Rivers Coln and Cherwell had their lowest March flows since 1976 which is the lowest March flow for these sites. The River Ock also had its second from lowest March mean flow this year since the gauging station opened in 1979. The driest March in the Ock record was in the low flow winter of 1992.
Groundwater Levels
Groundwater levels at most sites have changed very little over the past month. Only in the Oolites have levels changed very much since February. In the Great and Inferior Oolites of the West Cotswolds and Upper Thames groundwater levels continued to decline following limited recharge over the winter period. At Fringford OBH levels did rise in March although they remained exceptionally low for the time of year.
The full report and information for all Thames Regions is on the EA website
This entry was posted in
News and tagged
Drought,
Environment Agency,
Flood. Bookmark the
permalink.

